
Jku Master Project Network Devices Power Consumption Analysis
A master's project measuring the power consumption of network devices under different traffic loads. A FritzBox smart plug captures energy data while Go tooling generates UDP, TCP, and Layer-2 loads; results are exported to CSV and Excel for analysis.
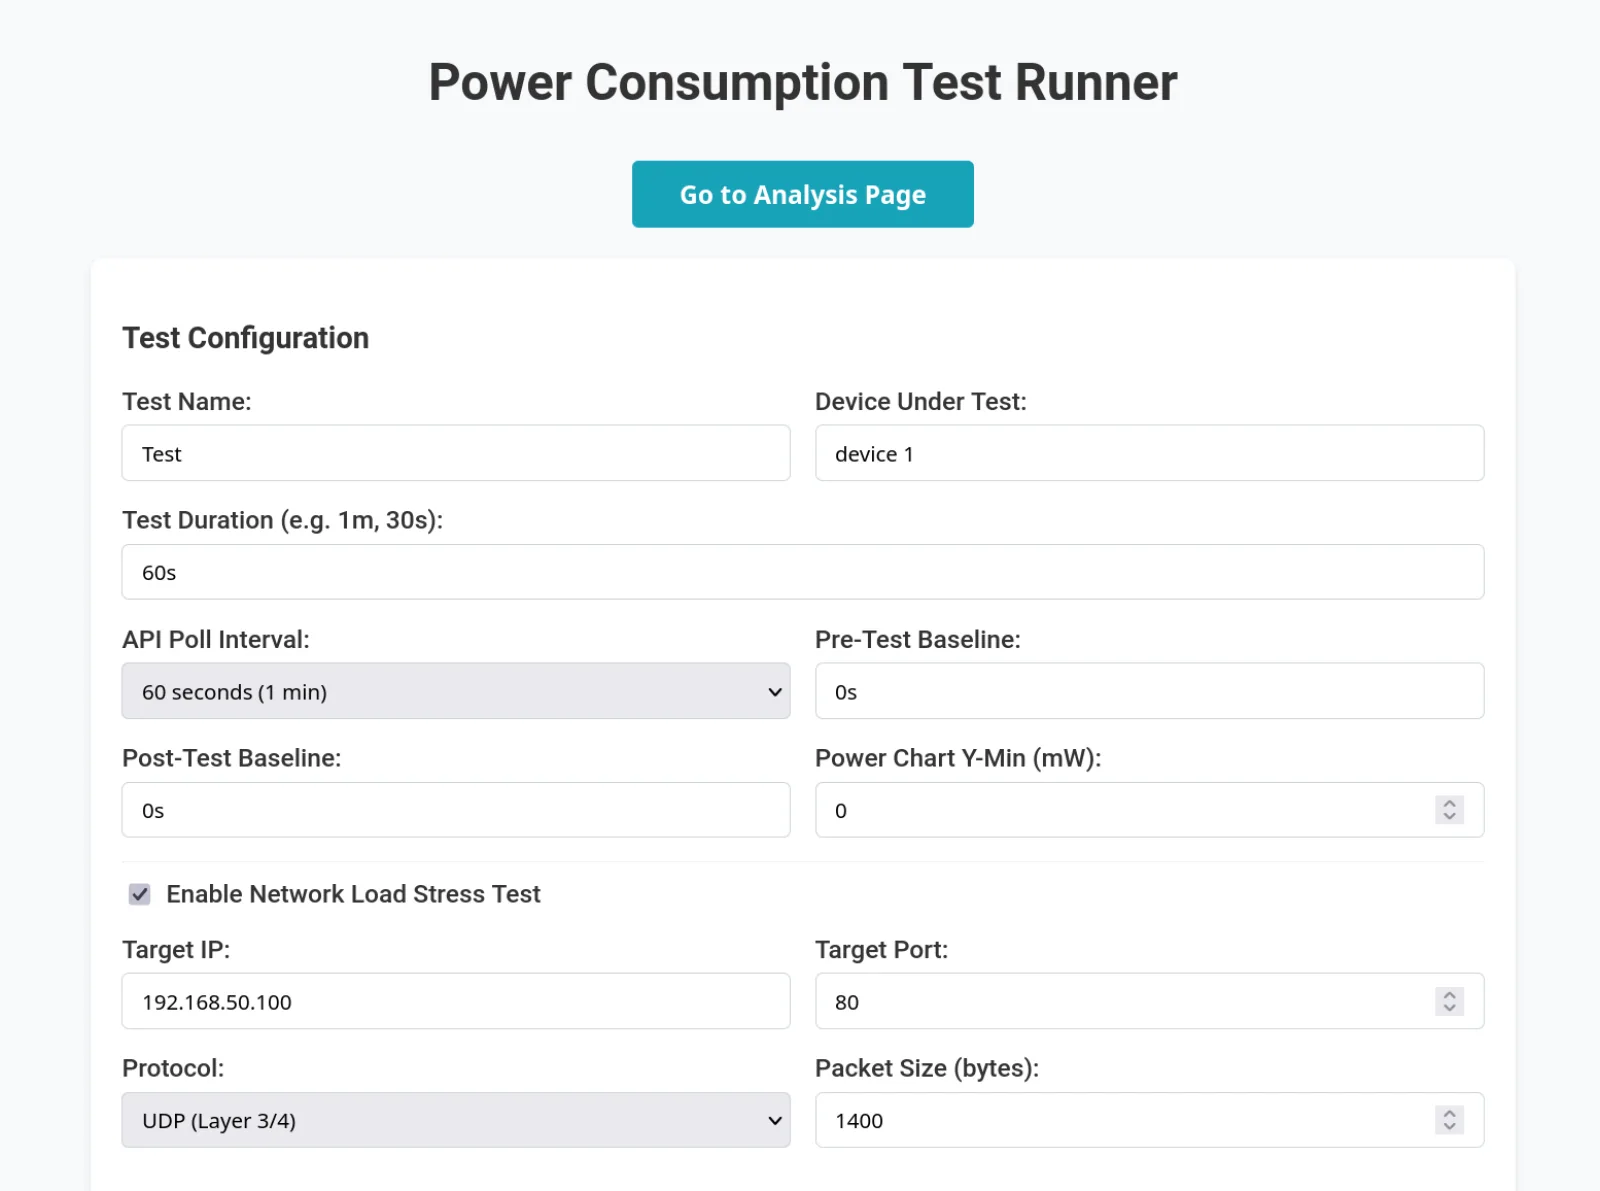
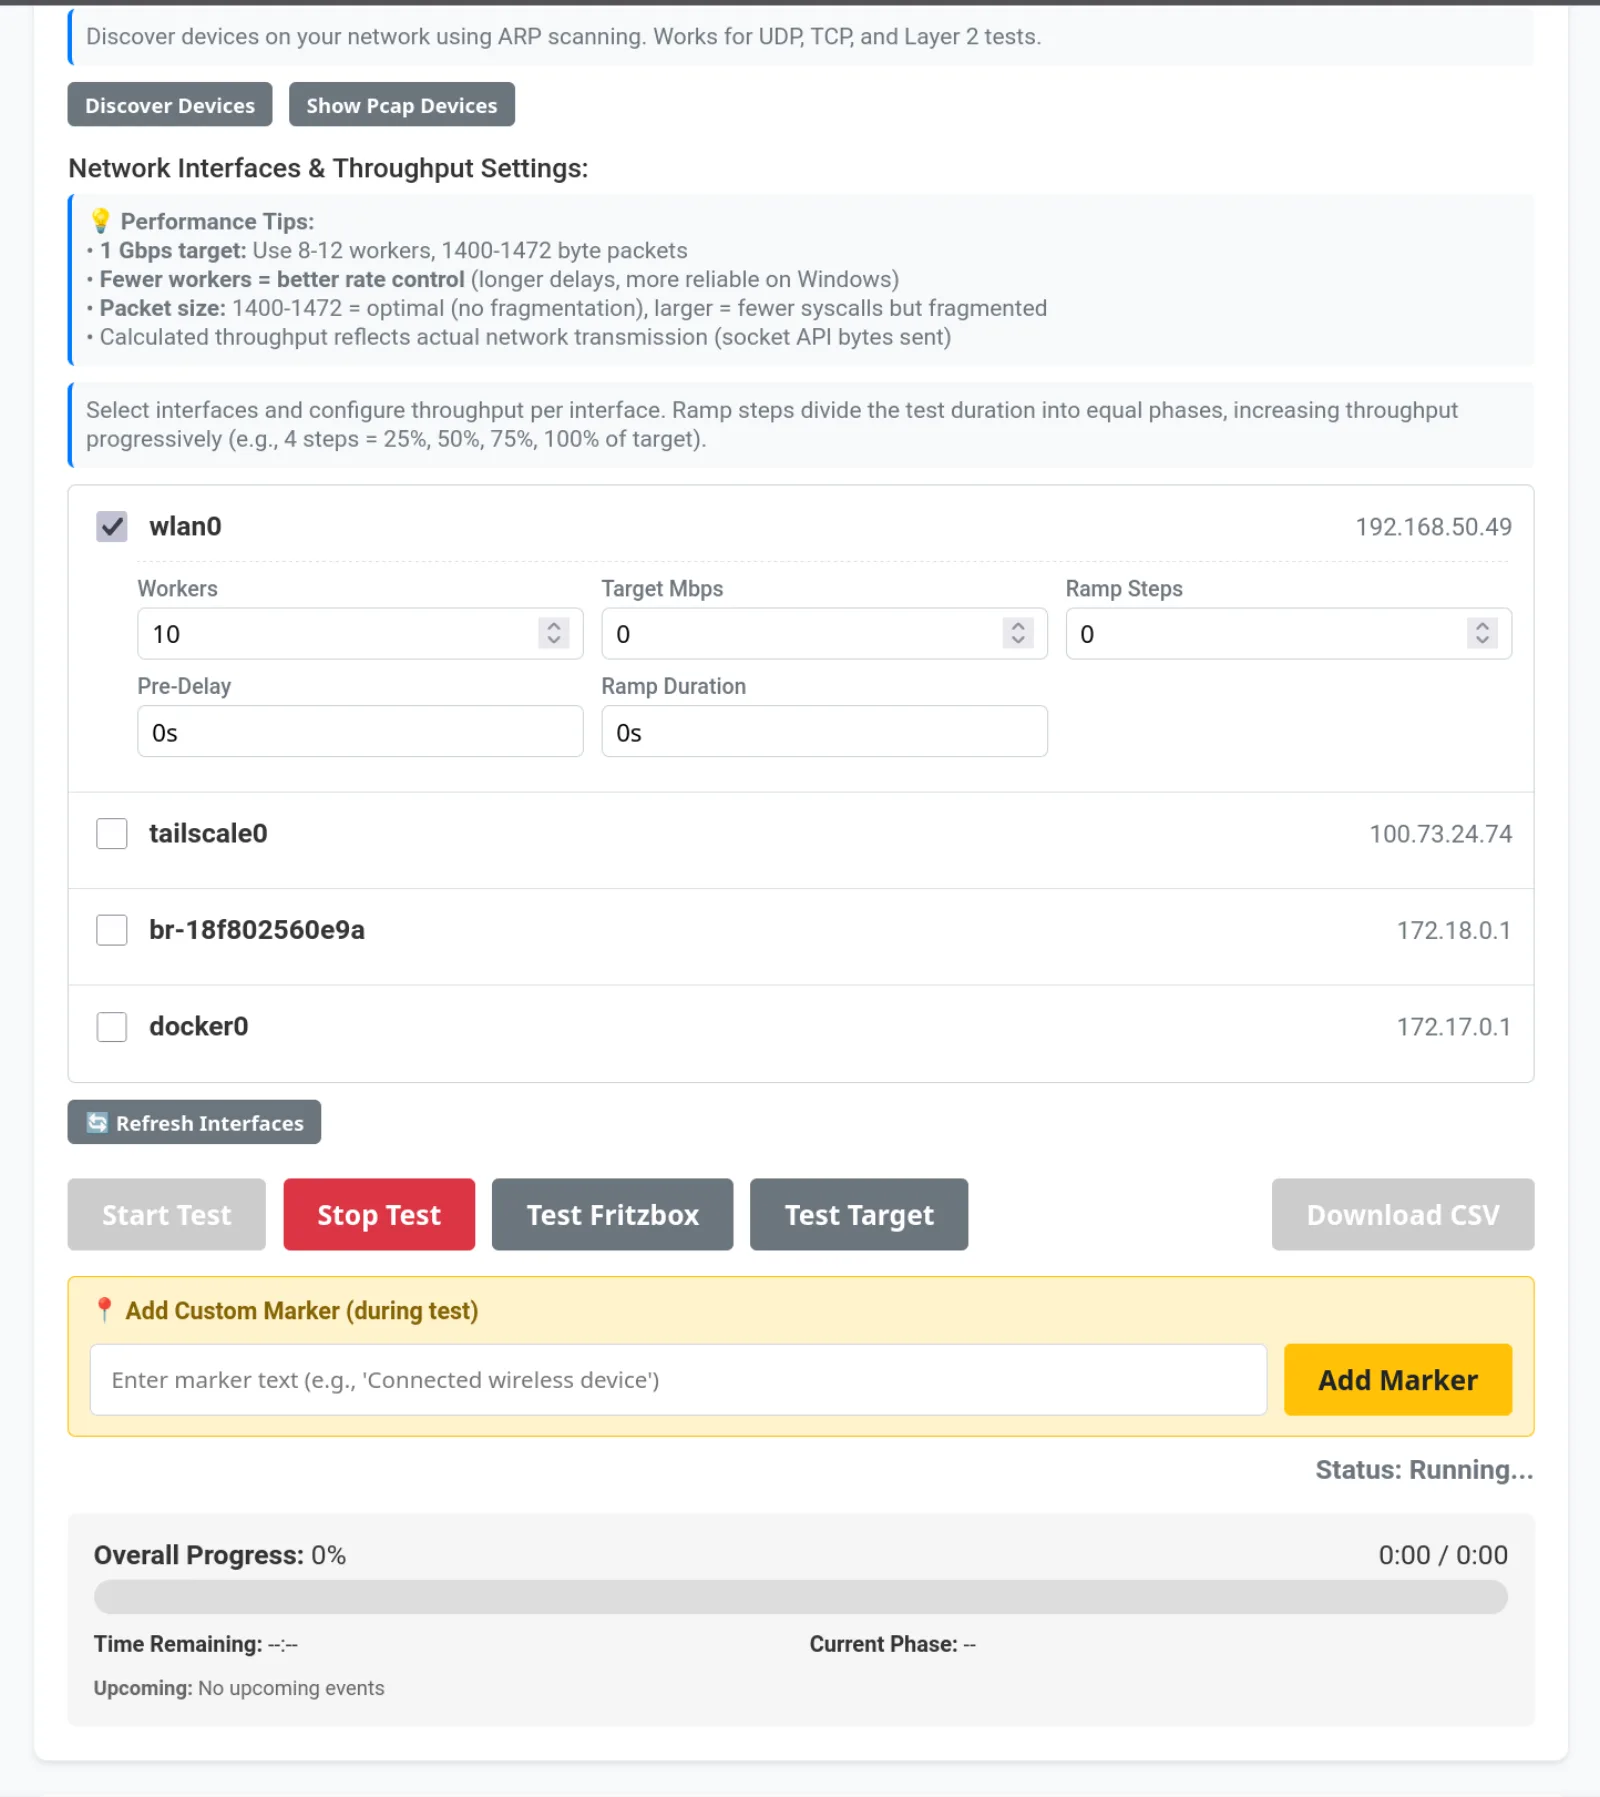
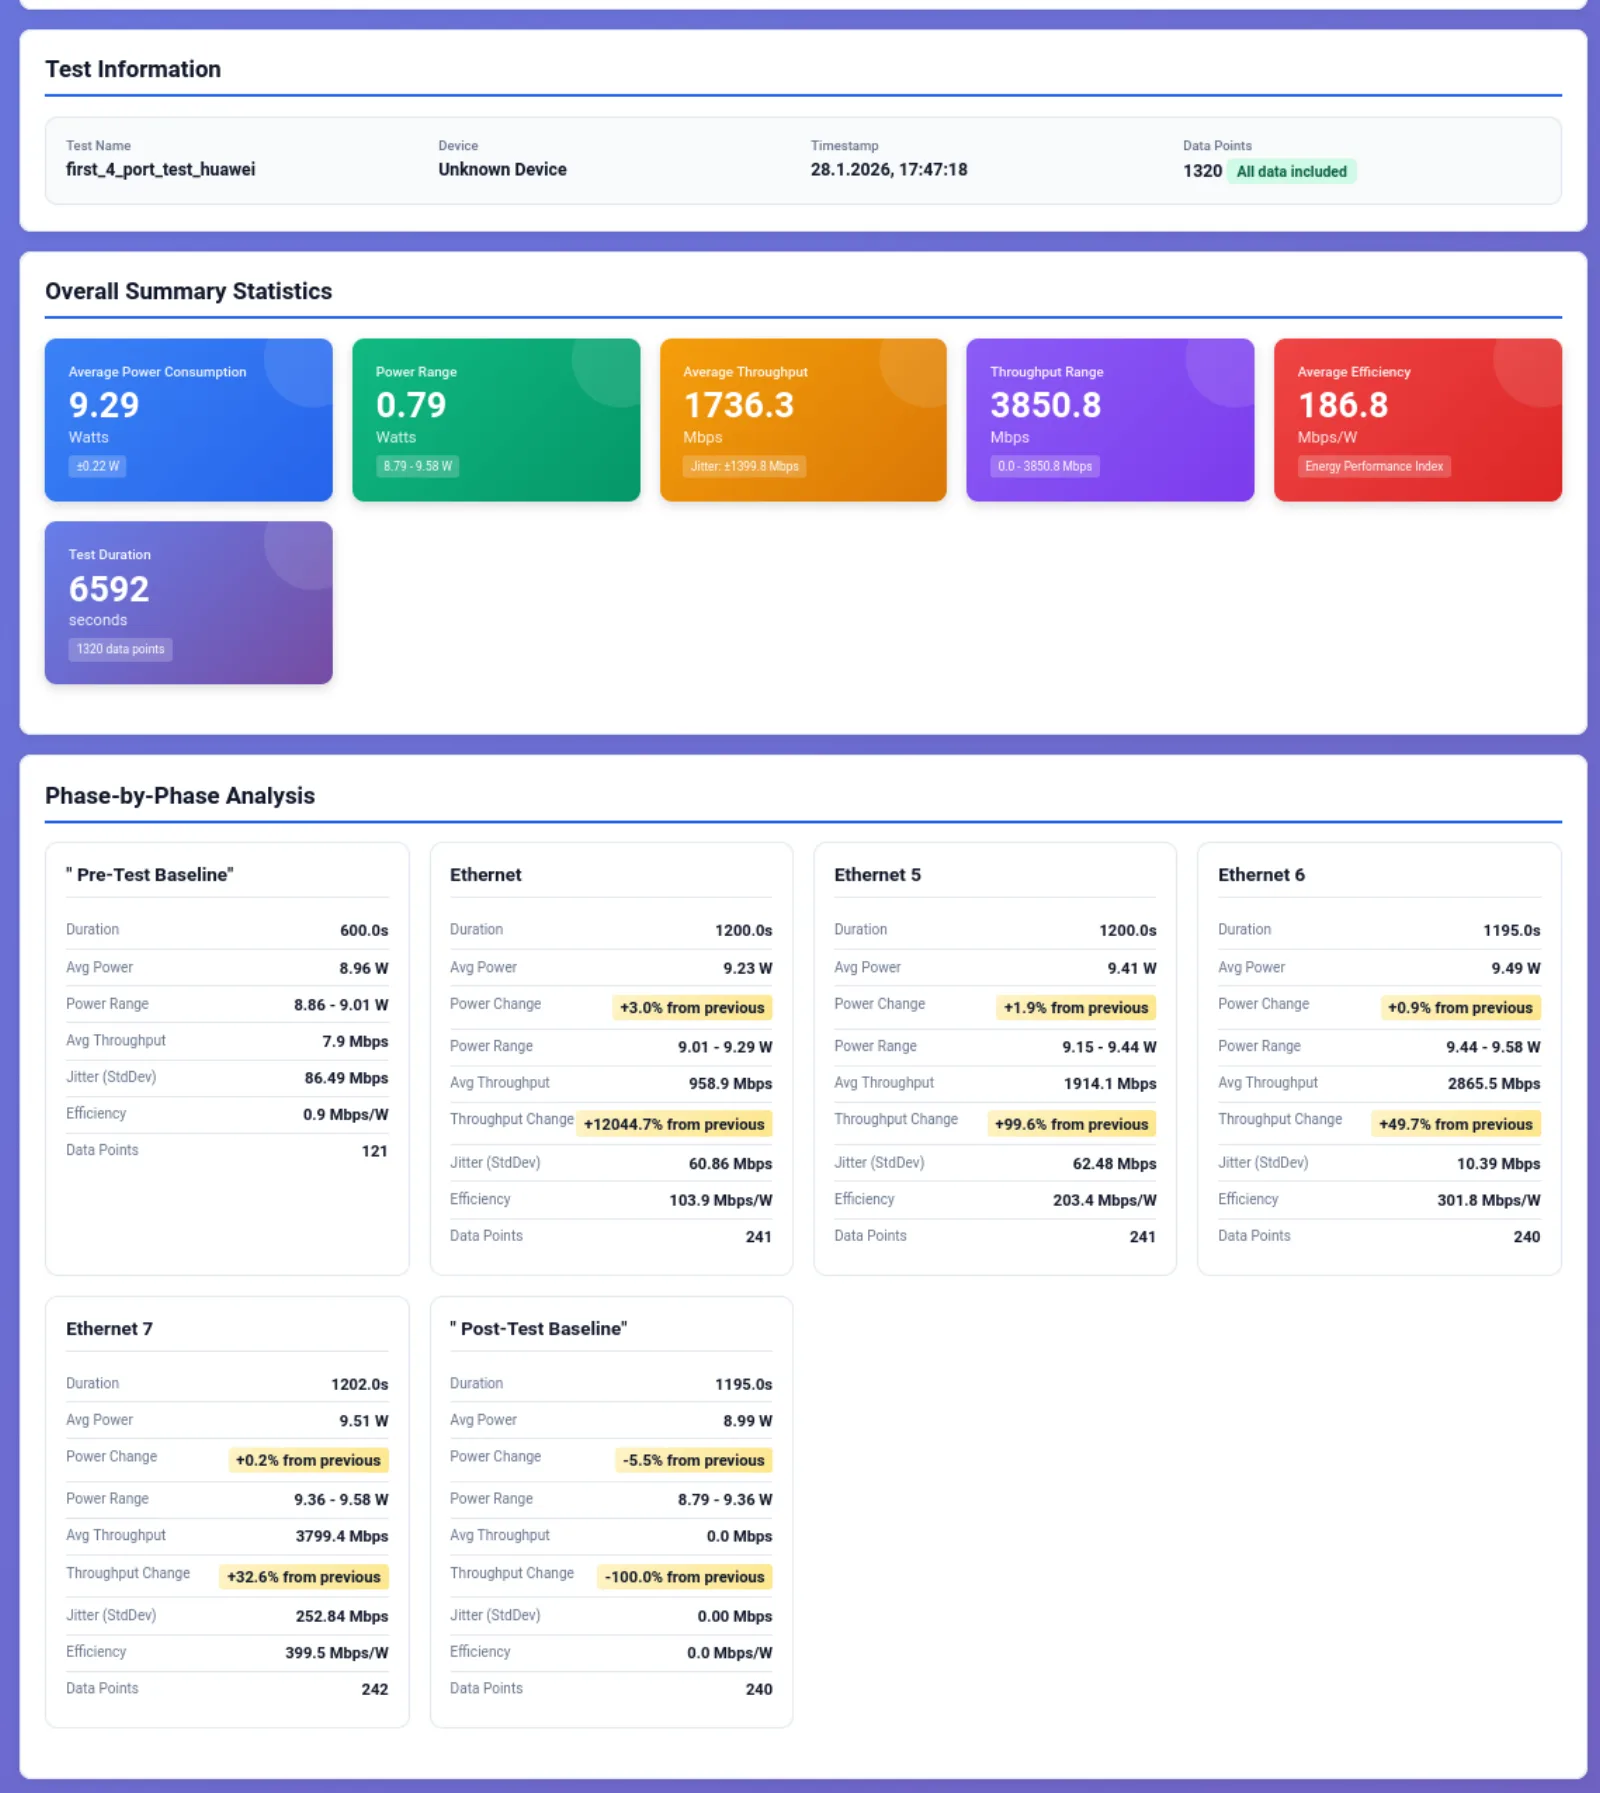
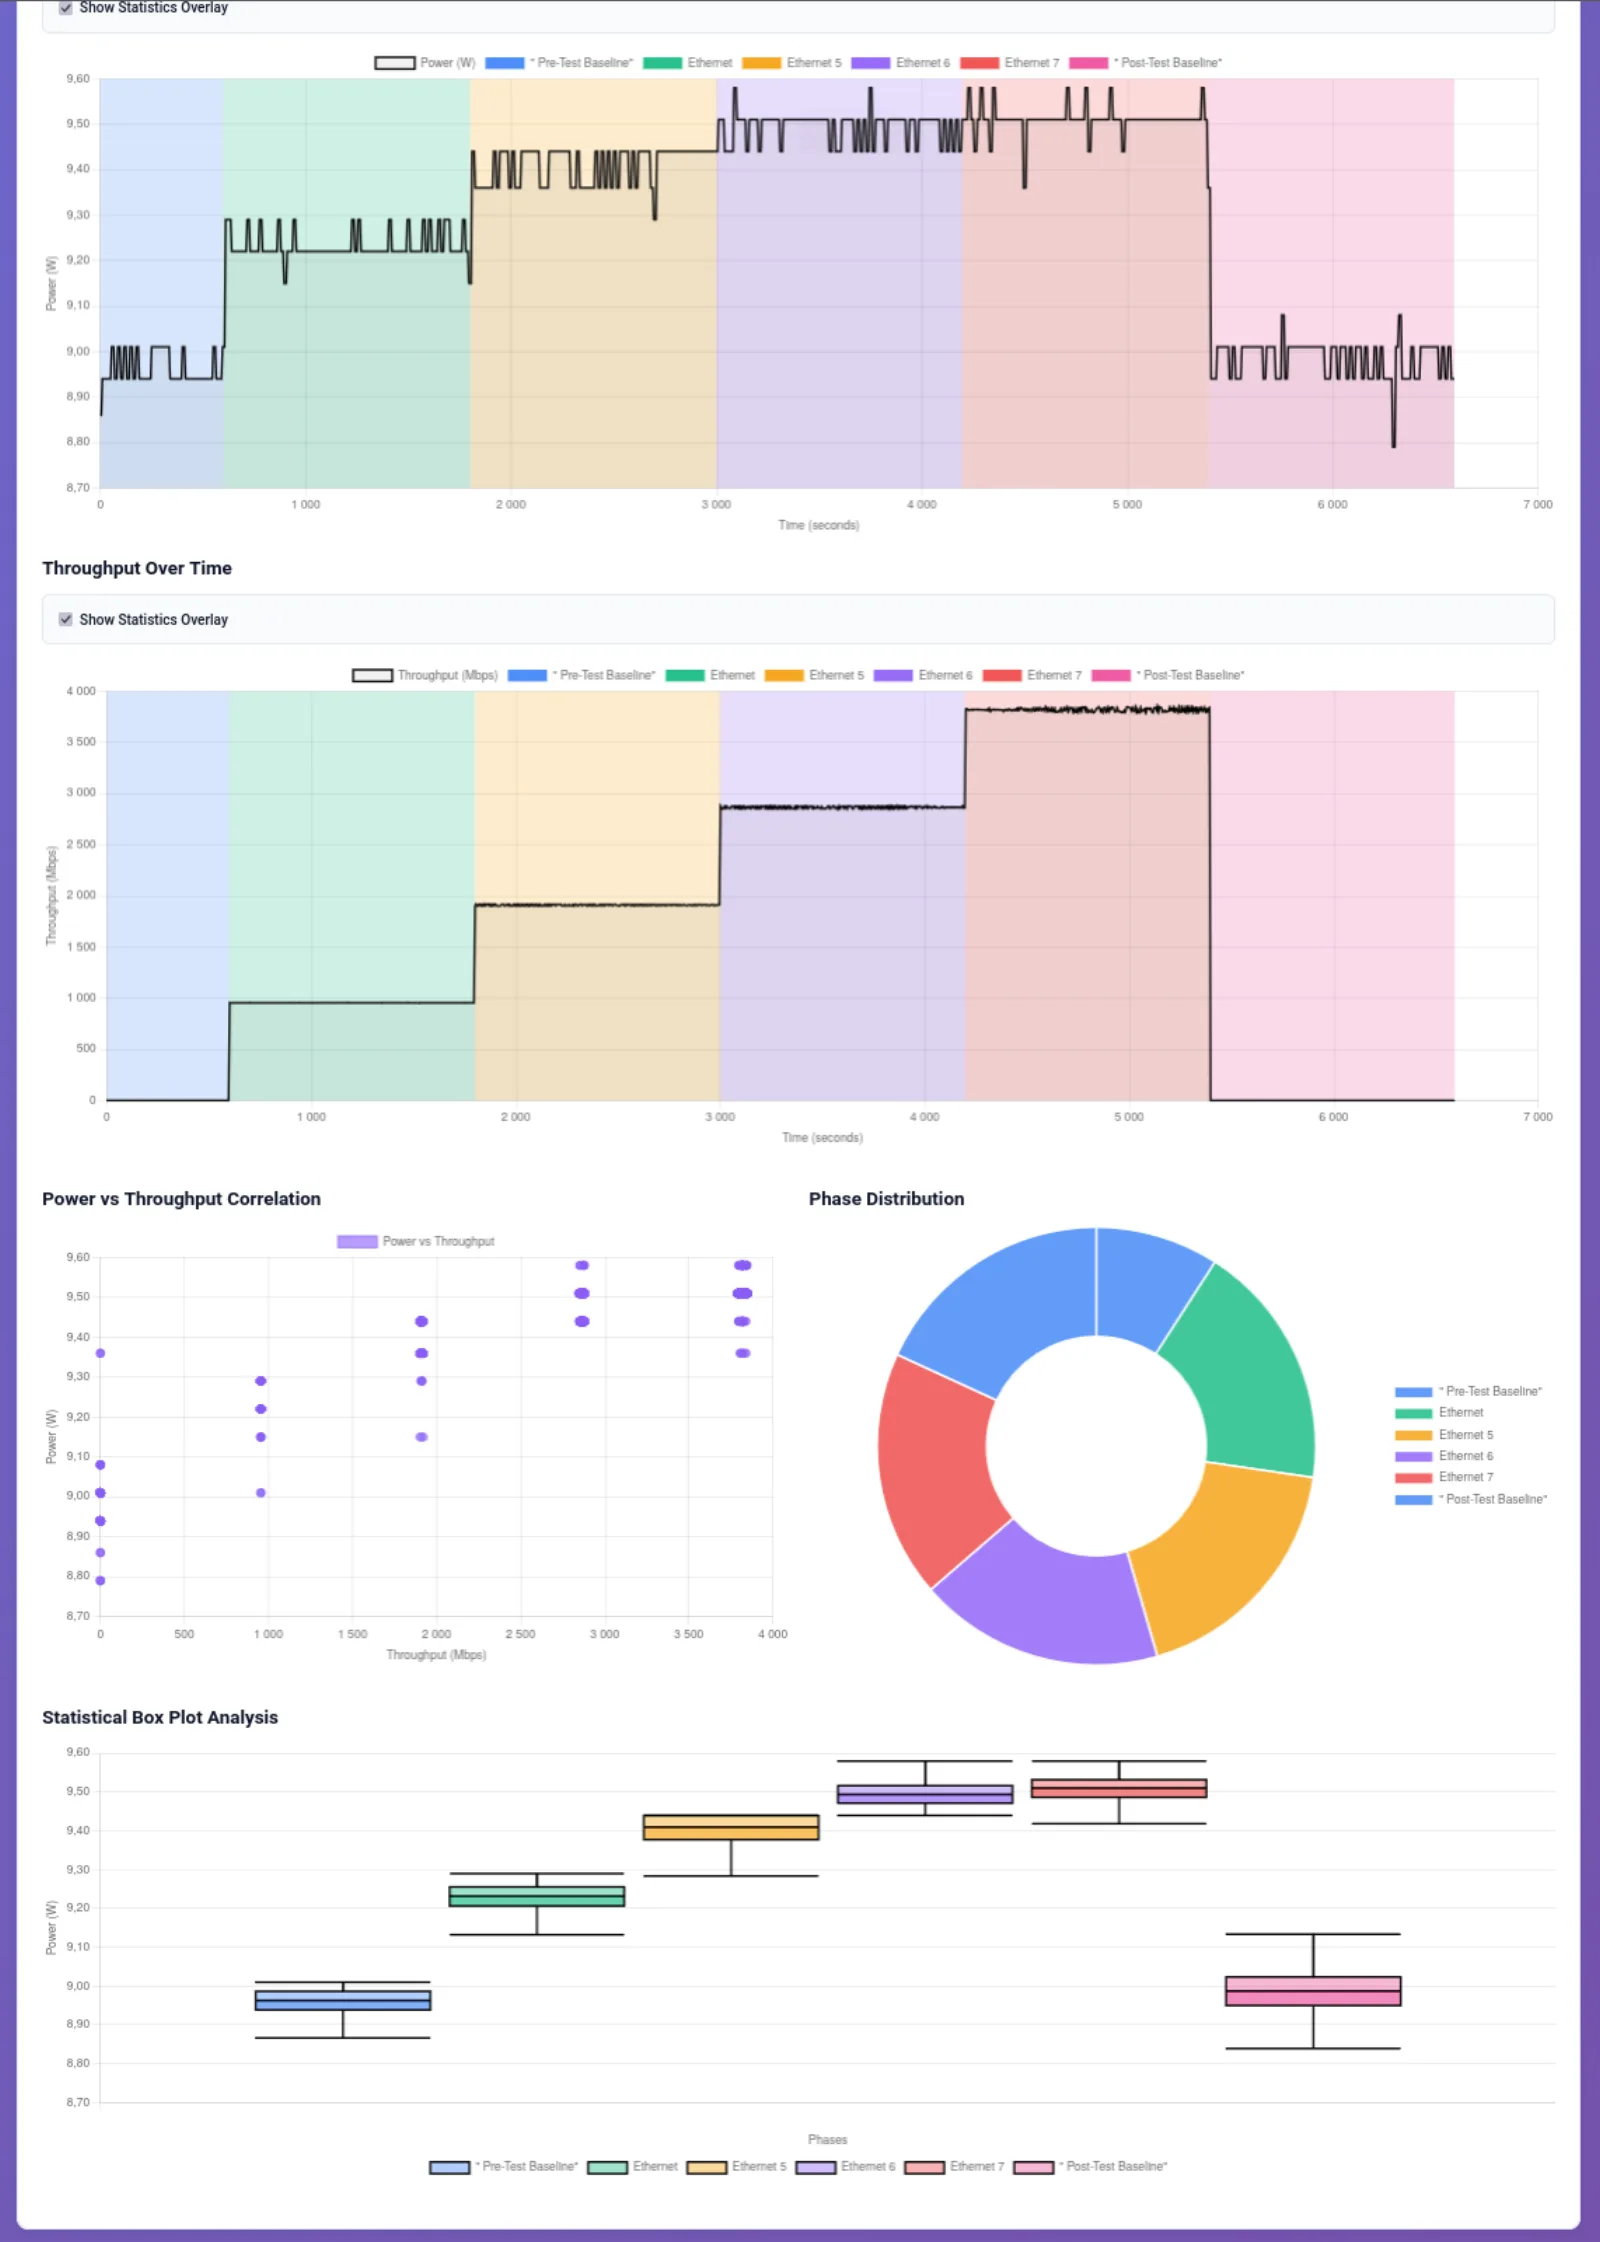
A university master's project measuring how a network device's power draw responds to the traffic it's actually pushing, rather than relying on vendor datasheet figures that only cover idle and theoretical-max states. The study was structured around eight research questions covering how power scales with throughput, packet size, protocol (UDP/TCP/L2), and device class, and whether a cheap consumer smart plug is even precise enough to answer them. Four devices under test (including a FritzBox router, a Huawei switch, and an Asus router) were measured via a DECT 200 smart plug read over the FritzBox TR-064 SOAP API — which only refreshes its power reading roughly every 15 seconds, so the load generator runs each traffic level for a fixed dwell time long enough to get multiple stable readings rather than trusting any single sample. Purpose-built Go tooling generates the actual load: UDP flooding, TCP streams, and raw Layer-2 frames via libpcap/gopacket, with a hybrid precise-sleep timer to hold exact target packet rates instead of drifting under the OS scheduler's default sleep granularity. Of the three approaches, raw UDP flooding turned out to be the most reliable way to saturate a device's NIC on demand; TCP's own congestion control fought against trying to hit a fixed target rate, and crafting raw L2 frames added overhead without a measurable benefit over UDP. The results showed the FritzBox device was CPU-bound rather than NIC-bound — its power draw plateaued well before line-rate as its own packet-processing became the bottleneck — while the Huawei switch and Asus router both scaled power draw cleanly and near-linearly with throughput. Power and load data are correlated and exported to CSV/Excel so the resulting power-vs-throughput curves can be compared across devices, turning what would otherwise be a manual lab measurement into a repeatable, scripted experiment.
Architecture
graph TD
  LoadGen["Go loadgen
(UDP / TCP / Layer2 workers)"] -->|saturating traffic| DUT["network device under test"]
  DUT --> Plug[("FritzBox smart plug
power reading")]
  LoadGen -->|per-interface throughput| Correlate["timestamped correlation"]
  Plug -->|watts over time| Correlate
  Correlate --> Export["CSV / Excel export"]
Under the hood
Each UDP worker batches packets before sleeping, recalculating its rate-limit delay only once per batch instead of after every single packet — needed to hit precise target throughputs without burning CPU on per-packet sleeps.
const batchSize = 10 // Send 10 packets before sleeping
packetCount := 0
delay := g.getWorkerDelayForInterface(config.PacketSize, ifaceName)

for {
	select {
	case <-ctx.Done():
		return
	default:
		n, err := conn.Write(buffer)
		if err != nil {
			if ctx.Err() != nil {
				return
			}
			PreciseSleep(time.Millisecond)
			continue
		}
		g.updateInterfaceThroughput(ic.Name, n)
		packetCount++

		if delay > 0 && packetCount >= batchSize {
			PreciseSleep(delay * time.Duration(batchSize))
			packetCount = 0
			// Re-read delay once per batch (target may change during ramping)
			delay = g.getWorkerDelayForInterface(config.PacketSize, ifaceName)
		} else if delay == 0 {
			packetCount = 0
			delay = g.getWorkerDelayForInterface(config.PacketSize, ifaceName)
		}
	}
}